Multimedia on the Web
There are many ways to make the content of websites more interesting by adding multimedia to it.
Images. The most basic way is to add the images on a web page.You embed them using HTML tag or CSS properties like background-image. Using JavaScript and CSS you can manipulate images on websites, adding more dynamics to them. For example, you can replace them or change their properties like size.
SVG. Scalable Vector Graphics (SVG) is an XML based vector image format. SVG has a large number of features. It supports drawing arbitrary shapes, curves, animations and interactivity. SVG is represented by markup language similar to HTML. You can use JavaScript and CSS to animate SVG images.
Embedded elements. You can embed on websites multiple types of external content including plugin technologies: Java Applets, Flash, PDF, video and audio files, images. You can do this using <embed> and <object> HTML tags. However currently these embedding methods and plugin technologies have lost their importance and are used less and less often.
Video and audio. HTML5 provided <video> and <audio> elements for embedding video and audio files and some JavaScript APIs for controlling them. Plugins for this purpose have become unnecessary.
Canvas. Introduced in HTML5 the <canvas> element can be used to draw graphics through JavaScript API.
The next part of this chapter focuses on graphics created using the Canvas API.
Canvas API Tutorial
Canvas drawing API is based on JavaScript. The <canvas> element creates a drawing surface on web page, where graphics can be generated using JavaScript. Its two attributes the width and the height specify the size of the drawing area.
<canvas id="myCanvas" width="200" height="150"></canvas>
Rendering context
The <canvas> element has rendering context, which is the main component of Canvas API. The context can be 2D or 3D that is called WebGL and is based on OpenGL ES.
To obtain a context object for 2D graphics call the getContext() method with the argument “2d” on the canvas element:
var canvas = document.getElementById('myCanvas');
var context = canvas.getContext('2d');
For 3D graphics pass “webgl” string to the getContext():
var context3D = canvas.getContext('webgl');
Further part is about 2d graphics.
The getContext() method for ‘2d’ argument returns CanvasRenderingContext2D object, which provides methods for creating graphics.
Canvas area
The canvas is a rectangular area on a web page. Its dimensions are specified by the width and the height attributes of the <canvas> element and the corresponding width and height properties of the Canvas object.
The starting point of the canvas grid is located in the left top corner of the canvas at coordinate (0, 0). X coordinates increase to the right and Y coordinates increase to the bottom of the screen.
<canvas id="canvas" width="200" height="150" style="border: solid black 1px;"></canvas>
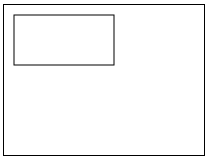
Drawing Rectangles
The rectangle is the only shape that can be drawn directly on the 2D context. There are three methods for working with rectangles:
fillRect(x, y, width, height) – draws a filled rectangle,
strokeRect(x, y, width, height) – draws a rectangular outline.
clearRect(x, y, width, height) – clears the specified rectangular area.
var canvas = document.getElementById('canvas');
var context = canvas.getContext('2d');
// draws a filled rectangle with a width of 100 and a height of 50
context.fillRect(10, 10, 100, 50);

// clears the reactangle
context.clearRect(10, 10, 100, 50);
// draws an otulined rectangle
context.strokeRect(10, 10, 100, 50);
Drawing Paths
A path is a sequence of points connected by line or curve segments. Paths allow you to create complex lines and shapes. The followed methods work with paths:
beginPath() – begins a new path,
closePath() – adds straight line to the start of the current sub-path.
stroke() – draws the current path or shape by stroking its outline.
fill() – draws a shape created from paths by filling the path’s content area.
Moving the pen
You can move the pen from one point to another and begin a new sub-path.
moveTo(x, y) – moves the pen to the specified coordinates.
// moves the pen to the coordinates (120, 60)
context.moveTo(120, 60);
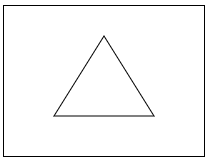
Lines
To draw a line begin a path and use lineTo() method.
lineTo(x, y) – draws a line from the current position to the position specified by x, y coordinates.
var canvas = document.getElementById('canvas');
var context = canvas.getContext('2d');
// draws stroked triangle:
context.beginPath();
context.moveTo(100, 30);
context.lineTo(50, 110);
context.lineTo(150, 110);
context.closePath();
context.stroke();
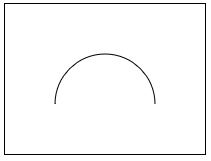
Arcs
Arcs and circles you can create using the arc() or the arcTo() methods.
arc(x, y, radius, startAngle, endAngle, counterclockwise) – draws an arc centered at point (x, y) with a given radius, and between start angle and end angle expressed in radians. 0 means that the start is in position 3 hours. The last argument indicates if start angle and end angle should be calculated counterclockwise. It adds a straight line between the current point and the beginning of the arc.
context.beginPath();
context.arc(100, 100, 50, 0, Math.PI, true); // draws a semicircle
context.stroke();
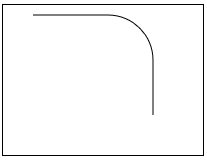
arcTo(x1, y1, x2, y2, radius) – draws an arc with a specified radius which is tangent to the line between the current point and the point (x1, y1) and also the line between the points (x1, y1) and (x2, y2). It is used for making rounded corners. It draws a straight line between current point and the beginning of the arc.
context.beginPath();
context.moveTo(30, 10);  // start point
context.lineTo(100, 10);  // draws a horizontal line
context.arcTo(150, 10, 150, 60, 45);  // draws an arc
context.lineTo(150, 110);  // draws a vertical line
context.stroke();
Curves
You can draw Bezier curves in a cubic and quadratic variety.
bezierCurveTo(c1x, c1y, c2x, c2y, x, y) draws a cubic Bezier curve from the current point to the point (x, y) using the control points (c1x, c1y) and (c2x, c2y).
context.beginPath();
context.moveTo(10, 20);
context.bezierCurveTo(10, 100, 190, 100, 190, 20);
context.stroke();
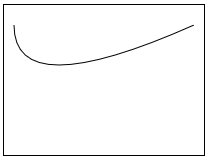
quadraticCurveTo(cx, cy, x, y) – draws a quadratic Bezier curve from the current point to the
point (x, y) using a control point of (cx, cy).
context.beginPath();
context.moveTo(10, 20);
context.quadraticCurveTo(10, 100, 190, 20);
context.stroke();
Rectangles
In addition to creating rectangular shapes using the previously mentioned methods, rectangles can be created as rectangular paths with the rec() method.
rect(x, y, width, height) – draws a rectangle, with top-left corner at the point (x, y) and with the given width and height. It creates a path rather than a separate shape.
Colours
There are two drawing operations: stroke and fill. Stroke colors outline of a shape and fill fills in the shape with a specified style.
How shapes and outlines are displayed is based on the strokeStyle and fillStyle property settings.
strokeStyle – set the style for shapes outlines
fillStyle – set the style for filling shapes.
These properties can be set to string that specifies the HTML colour, a gradient object or a pattern object.
context.strokeStyle = 'red';
context.fillStyle = '#0000ff';
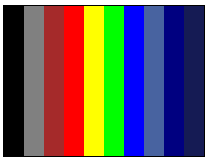
var colors = ['black', 'grey', 'brown', 'rgb(255, 0, 0)', 'rgb(255, 255, 0)', 'rgba(0, 255, 0, 1)', '#0000ff', '#4863A0', '#000080', '#151B54'];
for (var i = 0; i < 10; i++) {
    context.fillStyle = colors[i];
    context.fillRect(i * 20, 0, 20, 150);
}
Transparency
The canvas API allows you to draw semi-transparent shapes. This can be done either by setting the globalAlpha property or by assigning a semi-transparent colour to the strokeStyle and fillStyle properties.
globalAlpha – applies the defined transparency value to all new shapes on the canvas. The value must be between 0.0 (fully transparent) and 1.0 (fully opaque). The default value is 1.0.
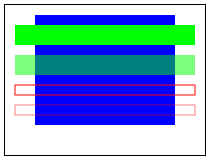
To assign a semi-transparent colour to the stroke and fill styles you can use the rgba() function. The first three arguments must have values between 0 and 255 and mean intensity of the colour, respectively red, green and blue. The fourth argument sets the transparency, where again 0.0 means fully transparent and 1.0 fully opaque.
// semi-transparent red stroke
context.strokeStyle = 'rgba(255, 0, 0, 0.5)';
// semi-transparent blue fill
context.fillStyle = 'rgba(0, 0, 255, 0.5)';
context.fillStyle = 'rgba(0, 0, 255, 1)';
context.fillRect(30, 10, 140, 110);
context.fillStyle = 'rgba(0, 255, 0, 1)';
context.fillRect(10, 20, 180, 20);
context.fillStyle = 'rgba(0, 255, 0, 0.5)';
context.fillRect(10, 50, 180, 20);
context.strokeStyle = 'rgba(255, 0, 0, 1)';
context.strokeRect(10, 80, 180, 10);
context.strokeStyle = 'rgba(255, 0, 0, 0.5)';
context.strokeRect(10, 100, 180, 10);
Gradients
You can also use color gradients when filling and stroking shapes. There are two methods createLinearGradient and createRadialGradient, which create CanvasGradient object. You can assign it to the strokeStyle and fillStyle properties.
createLinearGradient(x1, y1, x2, y2) creates a linear gradient object, a starting point is (x1, y1) and an end point is (x2, y2).
createRadialGradient(x1, y1, r1, x2, y2, r2) Creates a radial gradient object. The parameters represent two circles, the first has center at (x1, y1) and a radius of r1, the second has center at (x2, y2) and a radius of r2.
When a CanvasGradient object is created you can assign to it colours calling on it the addColorStop() method.
addColorStop(position, color) – adds a new colour to the gradient object. The position must be a number between 0.0 and 1.0, it specify the relative position of the colour in the gradient. The color argument must be a string representing HTML color.
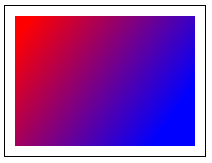
var gradient = context.createLinearGradient(20, 20, 160, 120);
gradient.addColorStop(0, 'red');
gradient.addColorStop(1, 'blue');
context.fillStyle = gradient;
context.fillRect(10, 10, 180, 130);
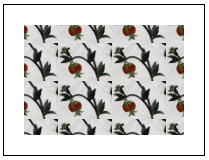
Patterns
Canvas API allows you to define a pattern of images.
createPattern(image, type) – creates canvas pattern object. The image argument is a CanvasImageSource, type is one of the following: repeat, repeat-x, repeat-y, no-repeat and indicates how to use the image.
Created pattern you assign to stroke or fill style.
var img = new Image();
img.src = 'https://www.javascriptinstitute.org/files/pattern.png';
img.onload = function() {
    var pattern = context.createPattern(img, 'repeat');
    context.fillStyle = pattern;
    context.fillRect(20, 20, 160, 110);
}
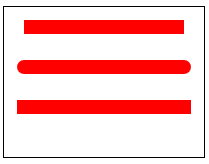
Line Styles
There are several properties which define style of lines.
lineWidth – set the width of the lines. The default value is 1.0
lineCap – specify the appearance of the end of lines. Possible values are: “butt”, “round” and “square”.
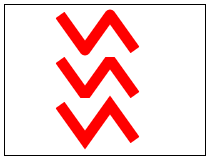
lineJoin – specify the appearance of corners where lines are connected. Possible values are: “bevel”, “round”, “mittel”
miterLimit – places upper limit on miter length when two lines join at a sharp angle. The default value is 10.0.
context.strokeStyle = '#ff0000';
context.lineWidth = 14;

context.beginPath();
context.lineCap = 'butt';
context.moveTo(20, 20);
context.lineTo(180, 20);
context.stroke();

context.beginPath();
context.lineCap = 'round';
context.moveTo(20, 60);
context.lineTo(180, 60);
context.stroke();

context.beginPath();
context.lineCap = 'square';
context.moveTo(20, 100);
context.lineTo(180, 100);

context.stroke();
context.strokeStyle = '#ff0000';
context.lineWidth = 11;

context.beginPath();
context.lineJoin = 'round';
context.moveTo(55, 10);
context.lineTo(80, 45);
context.lineTo(105, 10);
context.lineTo(130, 45);
context.stroke();

context.beginPath();
context.lineJoin = 'bevel';
context.moveTo(55, 55);
context.lineTo(80, 90);
context.lineTo(105, 55);
context.lineTo(130, 90);
context.stroke();

context.beginPath();
context.lineJoin = 'miter';
context.moveTo(55, 100);
context.lineTo(80, 135);
context.lineTo(105, 100);
context.lineTo(130, 135);
context.stroke();
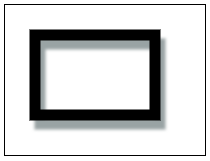
Shadows
Shadows are controlled by four properties:
shadowOffsetX – specifies the horizontal distance that shadow will be offset. The default value is 0. If it is set to a positive value, shadows will appear below of the shape. If both X and Y offset are set to 0, shadow is not visible.
shadowOffsetY – specifies the vertical distance that shadow will be offset. The default value is 0. If it is set to a positive value, shadows will appear on the right of the shape. If both X and Y offset are set to 0, shadow is not visible.
shadowBlur – specify the size of the blurring effect. The default value is 0.
shadowColor – specify the HTML color of the shadow.
context.shadowOffsetX = 5;
context.shadowOffsetY = 9;
context.shadowBlur = 3;
context.shadowColor = ' #99a3a4 ';
context.lineWidth = 11;
context.fillStyle = 'black';
context.rect(30, 30, 120, 80);
context.stroke();
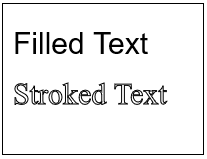
Text
Canvas API has to methods to work with text:
fillText() – draws a given text at the given (x, y) position,
strokeText() – draws the outline of the text at the given (x, y) position.
Text can be styled using the following properties:
font – specifies the text style,
textAlign the text alignment. Possible values: left, right, center, start, end.
textBaseline – baseline alignment. Possible values: top, hanging, middle, alphabetic, ideographic, bottom.
direction – the text direction. Possible values: ltr, rtr, inherit.
context.font = '32px Arial';
context.fillText('Filled Text', 10, 50);
context.font = '32px Open Sans';
context.strokeText('Stroked Text', 10, 100);
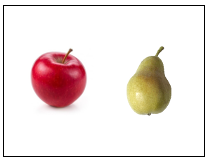
Images
The Canvas API allows you to use images on canvas. To drive image first obtain a reference to an HTMLImageElement object or provide an image URL as create image with the Image() constructor. Then use the drawImage() method.
drawImage(image, x, y) draws an source image specified by the image argument at the coordinates (x, y).
<img id="apple" src="/files/apple.png" alt="apple" style="display: none;">
var image = document.images[0];
image.addEventListener('load', function() {
    context.drawImage(image, 20, 40);
}, false);

var image2 = new Image();
image2.src = '/files/pear.png';
image2.addEventListener('load', function() {
    context.drawImage(image2, 110, 40);
}, false);
Transformations
Transformations allow you to translate the origin to a different position, rotate the canvas, scale it and transform.
There are two methods that allow you to deal with state of the canvas:save() and restore().
save() – save current state of canvas.
restore() – restores last saved state of the canvas.
You can transform the canvas using translate(), rotate(), scale() and transform methods().
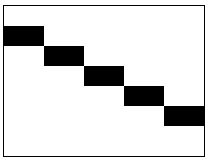
translate(x, y) moves the canvas and its origin left, right, up or down. x indicates the horizontal distance to move and y the vertical distance.
for (var i = 0; i < 5; i++) {
    context.save();
    context.translate(i * 40, i * 20);
    context.fillRect(0, 20, 40, 20);
    context.restore();
}
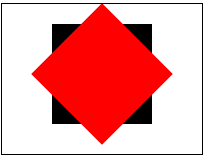
rotate(angle) – rotates the canvas clockwise around the origin by the specified in radians angle.
context.fillRect(50, 20, 100, 100);
// translate to rectangle center:
context.translate(100, 70);

// rotate 45 degrees:
context.rotate((Math.PI / 180) * 45);
// translate back
context.translate(-100, -70);

context.fillStyle = '#ff0000';
// draw rotated rectangle:
context.fillRect(50, 20, 100, 100);
scale(x, y) – scales the canvas, it stretches or shrinks distances horizontally along the X axle and vertically along the Y axle. If provided as arguments values are smaller than 1.0, they reduce the size. If values are greater than 1.0 they increase the size.
// stretch 2 times horizontally and decrease 2 times vertically:
context.scale(2, 0.5);
context.fillRect(10, 10, 70, 70);
transform(a, b, c, d, e, f) – multiplies the transformation of the canvas with matrix created from provided arguments of the method. It allows at the same time translate, rotate and scale the canvas. Method params indicate: a – horizontal scaling, b horizontal skewing, c vertical skewing, d – vertical skewing, e – horizontal moving, f – vertical moving.
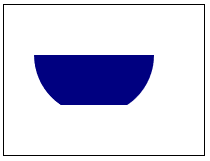
Clipping
You can define clipping region that specify drawing area. Nothing outside clipping region will be drawn. This allows you to hide unwanted parts of shapes.
clip() – defines clipping region by changing current path into the clipping path.
context.fillStyle = 'navy';
context.arc(90, 50, 60, 0, Math.PI, false);
context.clip();
context.fillRect(0, 50, 200, 50);
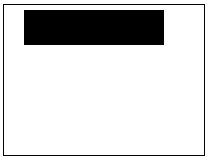
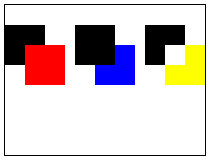
Compositing
By default new pixels are drawn on the top of pixels that are already in the canvas. Opaque pixels replace already existing pixels. However translucent pixels are combined with the old pixels in such a way that the old pixels show through the new pixels based on their transparency. This process of combining new translucent pixels with existing pixels is called composing.
There are different types of composing that you can specify by setting the globalCompositeOperation property.
globalCompositeOperation – sets the type of composing operation. The default value is source-over and other possible values are: source-in, source-out, source-atop, destination-over, destination-in, destination-out, destination-atop, lighter, copy, xor and others.
context.globalCompositeOperation = 'source-over';
context.fillStyle = 'black';
context.fillRect(0, 20, 40, 40);
context.fillStyle = 'red';
context.fillRect(20, 40, 40, 40);

context.globalCompositeOperation = 'destination-over';
context.fillStyle = 'black';
context.fillRect(70, 20, 40, 40);
context.fillStyle = 'blue';
context.fillRect(90, 40, 40, 40);

context.globalCompositeOperation = 'xor';
context.fillStyle = 'black';
context.fillRect(140, 20, 40, 40);
context.fillStyle = 'yellow';
context.fillRect(160, 40, 40, 40);
Pixel manipulation
JavaScript provides ImageData object that represents raw pixels from the canvas.
You can use ImageData object to directly read and write pixel data from the canvas to manipulate pixels.
ImageData object’s methods provide low-level access to the canvas:
createImageData(width, height) – creates a new ImageData object with the specified dimensions.
getImageData(left, top, width, height) – returns ImageData object representing pixels from the area of the canvas specified by left, top corner of rectangle and its width and height.
putImageData(myImageData, dx, dy) – puts pixels data into the context. The coordinates specify left, top corner of the pixel data, where to draw.
data – one-dimensional array containing the data in the RGBA order, values are integers between 0 and 255
width – width of the image,
height – height of the image.
var img = new Image();
img.src = '/files/flowers.png';

img.onload = function() {
    context.drawImage(img, 0, 0);
    grey(context, 0, 0, 100, 150);
};

function grey(context, x, y, width, height) {
    var imageData = context.getImageData(x, y, width, height);
    var data = imageData.data;
    for (var i = 0; i < data.length; i += 4) {
        var avg = (data[i] + data[i + 1] + data[i + 2]) / 3;
        data[i]     = avg; // red pixel component
        data[i + 1] = avg; // green pixel component
        data[i + 2] = avg; // blue pixel component
    }
    context.putImageData(imageData, x, y);
}
![]()
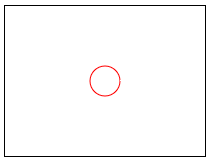
Hit detection
Canvas API provides method which allow you to detect whether mouse events take place within a specified area on the canvas.
isPointInPath(x, y) – determines whether a specified point falls within the current path.
context.arc(100, 75, 15, 0, 2 * Math.PI, false);
context.strokeStyle = 'red';
context.stroke();
canvas.onclick = function(event) {
    // get canvas size and position
    var boundingRect = canvas.getBoundingClientRect();
    // translate mouse event coordinates to canvas coordinates
    var x = (event.clientX - boundingRect.left) * (canvas.width / boundingRect.width);
    var y = (event.clientY - boundingRect.top) * (canvas.height / boundingRect.height);

    if (context.isPointInPath(x, y)) {
        alert('hit!');
    }
};
Reply